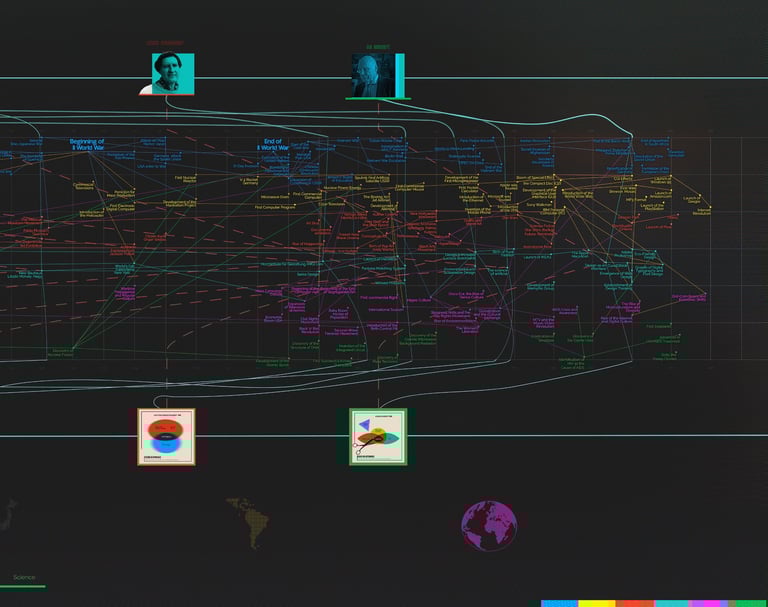
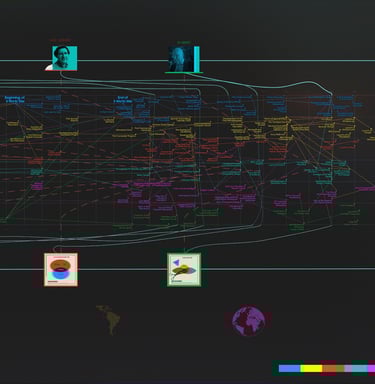
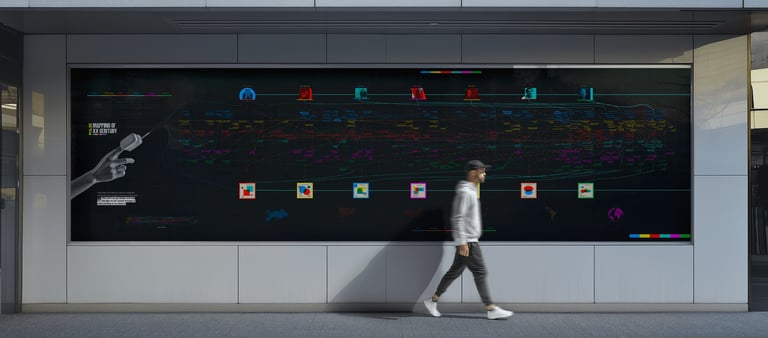
INFORMATION GRAPHIC-PULSE MAPPING OF XX CENTURY
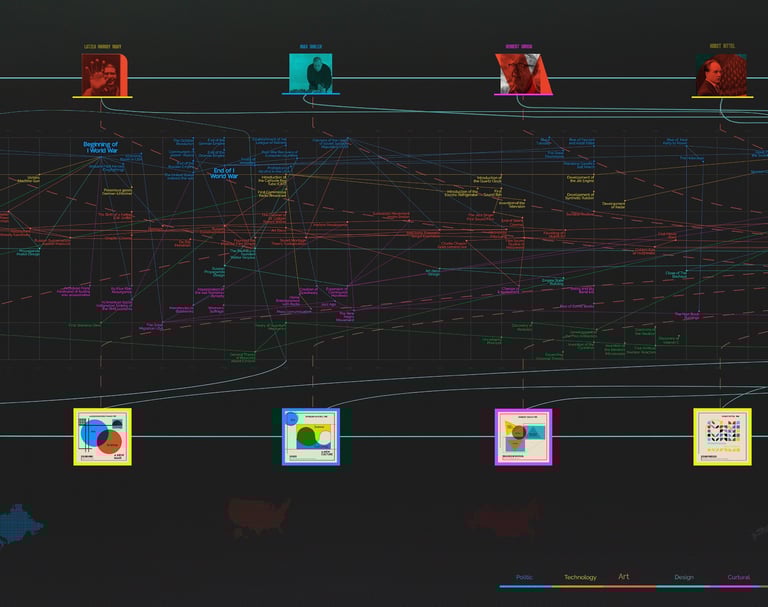
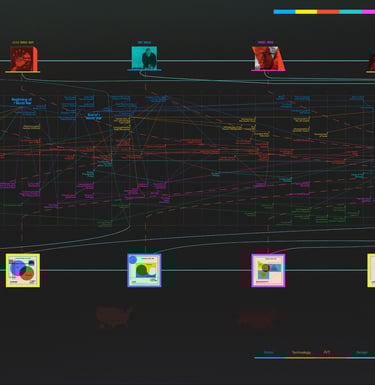
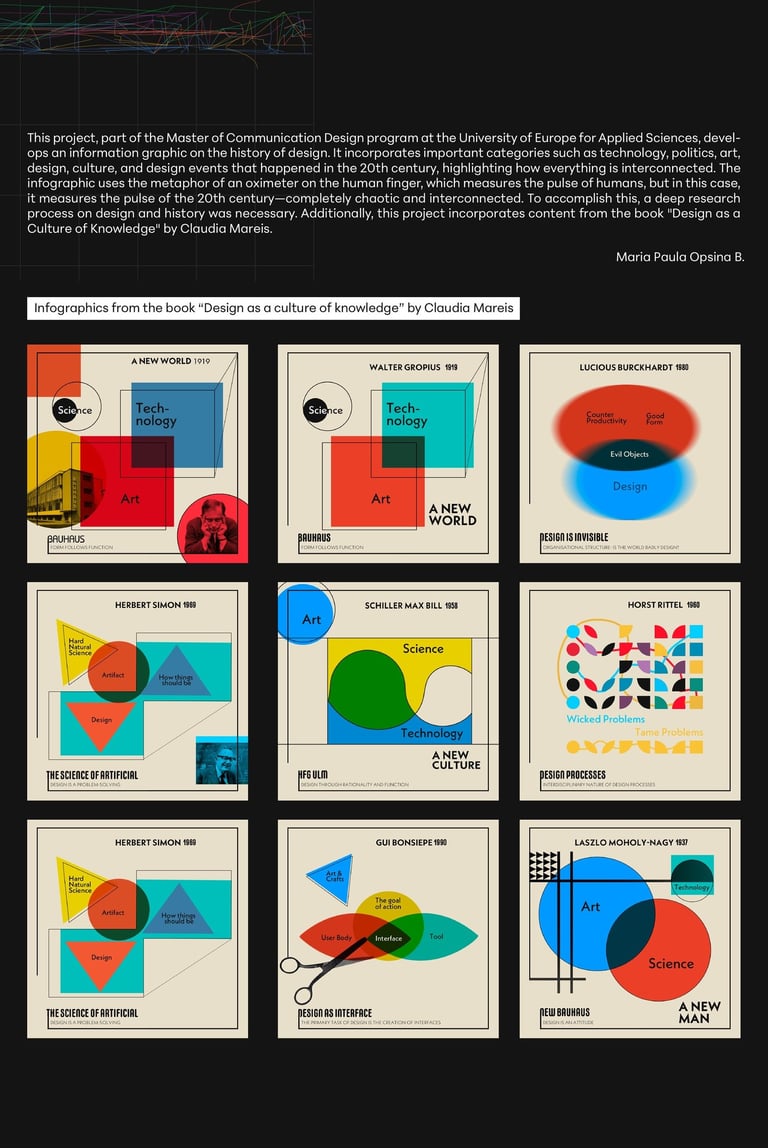
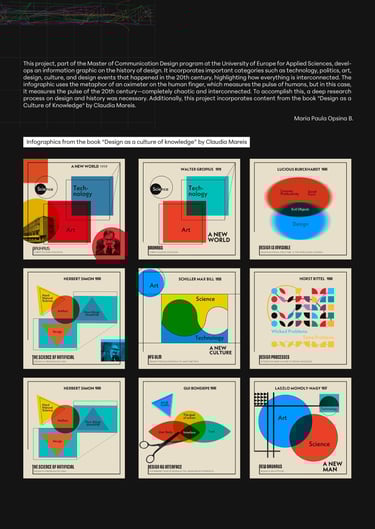
Pulse Mapping of the 20th Century is an information graphic that visualizes the history of design throughout the 20th century. The work highlights how design evolves in relation to art, politics, science, and culture, showing the constant interconnection between these forces.
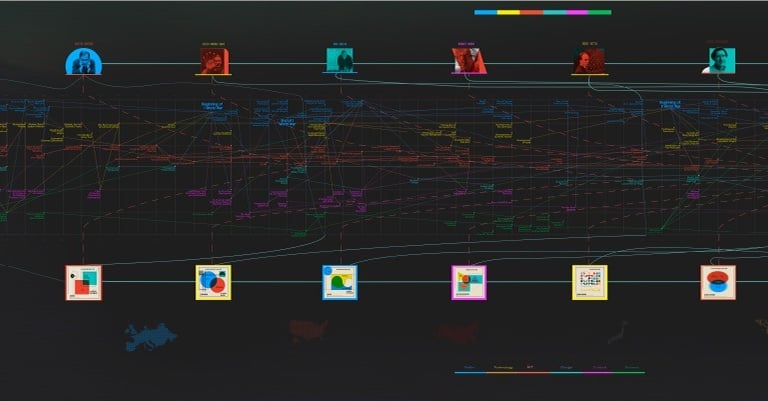
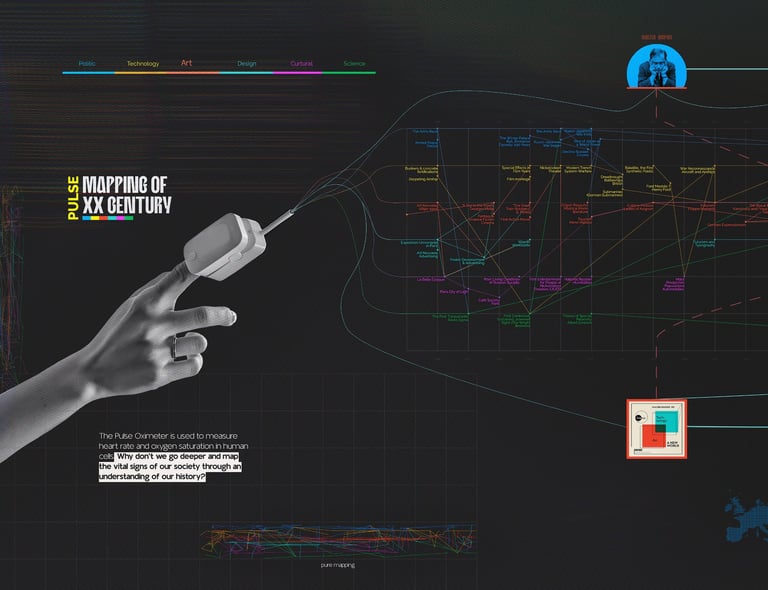
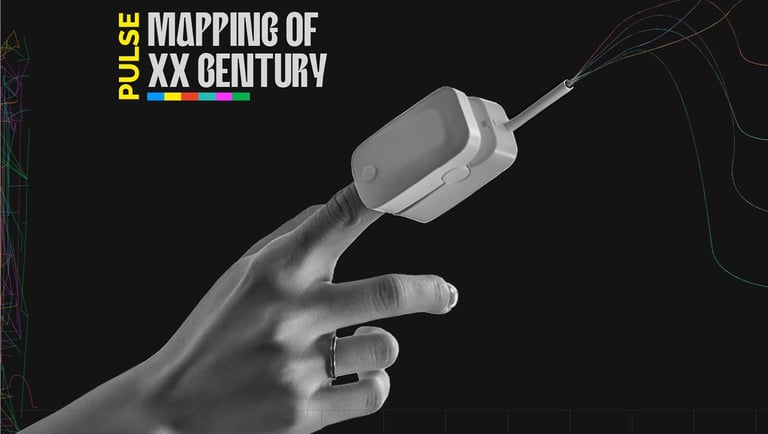
The metaphor of the pulse is used to map the century as the vital signs of society. Each peak and rhythm reflects moments of change, where creativity and innovation respond to global events and, in turn, influence the next steps in history.

Year: 2024
Format: Information graphic / timeline visualization
Medium: Large-format poster, digital illustration, data visualization
Role: Research, data structuring, visual concept, graphic design
Keywords: Information design, history of design, 20th century, data visualization, cultural mapping